Growth Strategy
How to calculate break-even ROAS before increasing ad spend
Calculate break-even ROAS using product costs, payment fees, shipping and returns. Follow a euro example and distinguish advertising revenue from profit.
Vladlens Kecko · · 4 min read
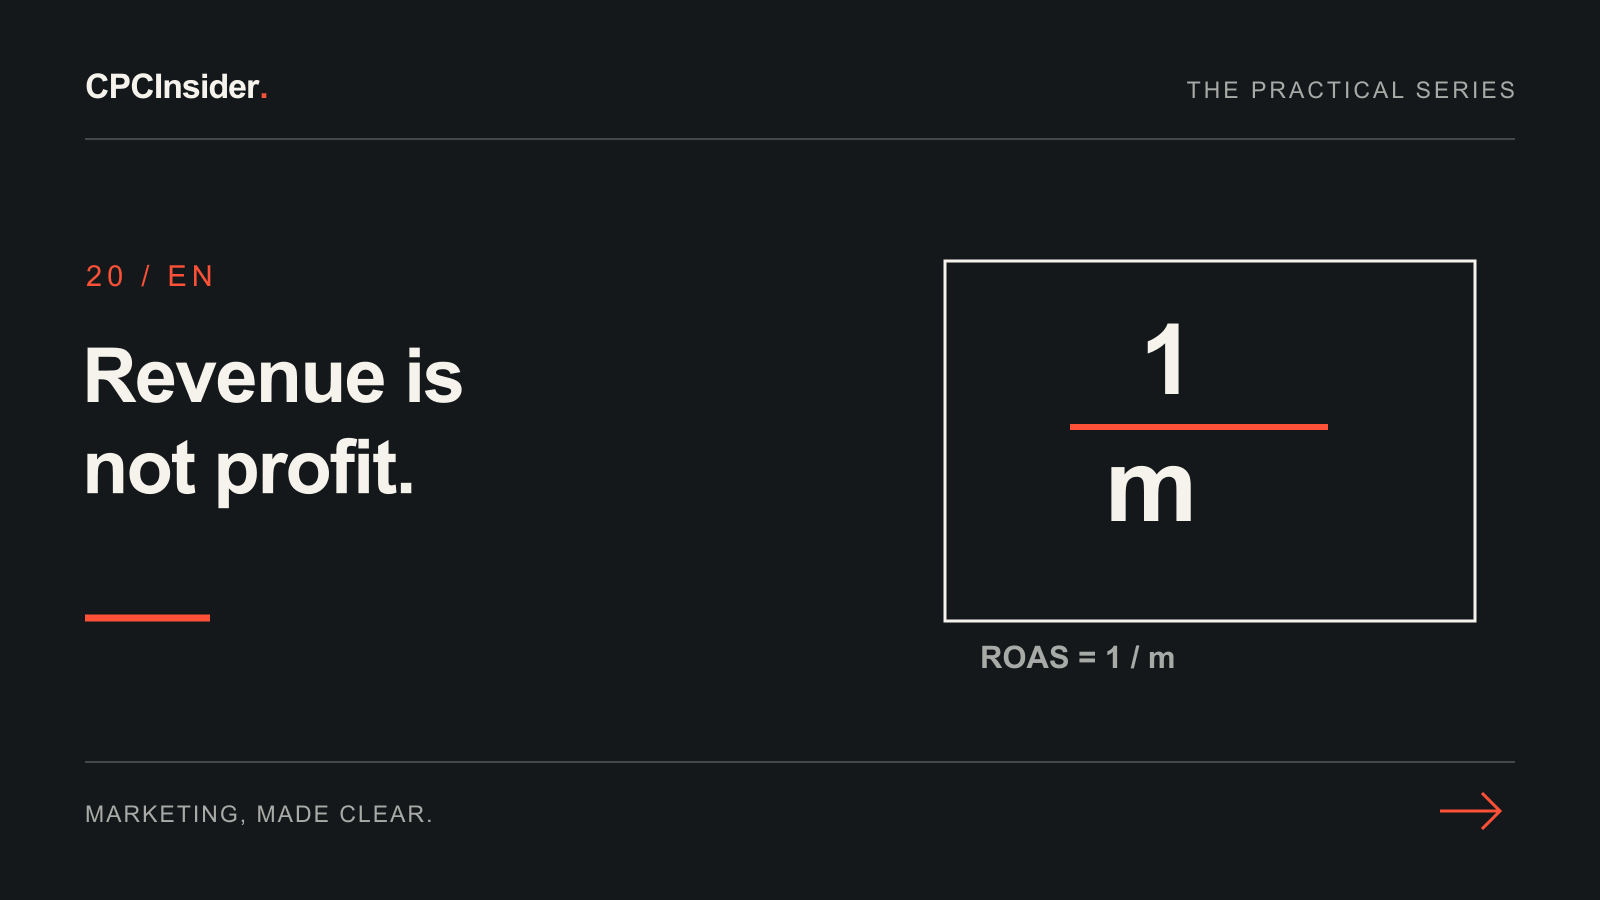
Break-even ROAS tells you how much revenue advertising must generate to cover a defined set of costs. The definition matters: covering product costs and ad spend is not the same as covering the whole business's overhead and profit target.
Start with consistent net revenue and contribution before advertising. Do not choose a ROAS target simply because another store says 3x or 5x works for it.
1. Define the revenue and costs you are comparing
Use the same revenue basis in your calculation and campaign review. Be explicit about discounts, refunded revenue and taxes rather than mixing a platform's gross order value with net revenue in your margin calculation. Ask your finance owner to confirm the business's treatment where needed.
List variable costs associated with fulfilling the order: goods, payment fees, business-paid shipping, packaging and relevant fulfilment or returns costs. Do not count the same refund twice by reducing revenue and treating the full refund as another expense.
Shopify's break-even ROAS guide explains the basic inverse-margin approach. The example here explicitly uses contribution after the listed variable costs, rather than assuming a product-only margin covers everything.
2. Work through this illustrative order
These are invented teaching numbers, not CPCInsider client results or a Latvian market benchmark.
| Item | Amount |
|---|---|
| Net order revenue on the chosen basis | €100 |
| Product cost | €45 |
| Payment fees | €3 |
| Business-paid delivery and packaging | €8 |
| Additional variable fulfilment/returns allowance | €4 |
| Total listed variable costs | €60 |
| Contribution before advertising | €40 |
Contribution margin = (€100 − €60) / €100 = 40%.
Contribution break-even ROAS = 1 / 0.40 = 2.5x. At €40 of advertising cost for this order, its €40 contribution is fully used. Fixed overhead and profit are still uncovered.
At €30 advertising cost, ROAS is approximately 3.33x and €10 contribution remains before fixed costs. Revenue efficiency and business profit are related, but they are not the same measure.
3. Set a target above the relevant break-even point
If you require €15 contribution after ads from this illustrative order, allowable ad cost becomes €40 − €15 = €25. The corresponding ROAS is €100 / €25 = 4x. This is a planning example, not a recommended target for every account.
If contribution before ads is zero or negative, there is no positive ad budget that fixes that order's economics under these assumptions. Review pricing, fulfilment, product mix or evidenced repeat purchases before scaling.
4. Copy the calculation worksheet
| Input or output | Your value |
|---|---|
| Revenue period, currency and revenue basis | Fill in |
| Net revenue per order | Fill in |
| Listed variable costs per order | Fill in |
| Contribution before ads | Revenue minus variable costs |
| Required contribution after ads | Fill in |
| Allowable ad cost | Contribution before ads minus required contribution |
| Required ROAS | Revenue divided by allowable ad cost, if positive |
Repeat by product group when margins differ materially. A blended ROAS can hide one product subsidising another. Use actual returned-order information when available rather than permanently relying on an initial estimate.
5. Compare attribution with business results
A Reddit question about break-even calculations asks whether delivery and payment fees should be included. The practical answer is to state the cost scope, not argue about one universal benchmark.
Platform-attributed revenue does not by itself prove incremental sales. Review total business revenue, acquisition costs and contribution alongside channel reports. Treat future repeat purchases as an assumption until your own customer cohorts support them. For click-level planning, continue with the CPC strategy guide.
Is higher ROAS always better?
Not necessarily. A high ratio on a small amount of spending may produce less total contribution than a lower ratio at a sustainable scale. Compare contribution, cash needs and delivery capacity, not just the ratio.
Find the next profitable growth decision
Request a free performance audit to discuss campaign economics and measurement. Our business growth service connects marketing priorities with the constraints and outcomes of the business.
About the author
Continue reading
How to create a 90-day marketing plan with a small team
Turn a marketing goal into a 90-day plan with clear priorities, owners, budget and review dates. Use a practical template and a worked business example.
How to choose a Google Ads agency in Latvia: 12 questions
A strong partner does more than manage an advertising account. It explains decisions, protects your data and owns the path toward a business outcome.
What should you agree with a fractional CMO for the first 90 days?
Hiring a fractional CMO? Use this checklist to agree responsibilities, deliverables, team support and success measures before the engagement starts.