Strategy
Net Promoter Score: calculate NPS and decide what to do with the feedback
Calculate NPS with the correct denominator, preserve the survey cohort and assign follow-up. Includes spreadsheet formulas and a reporting worksheet.
Vladlens Kecko · · 3 min read
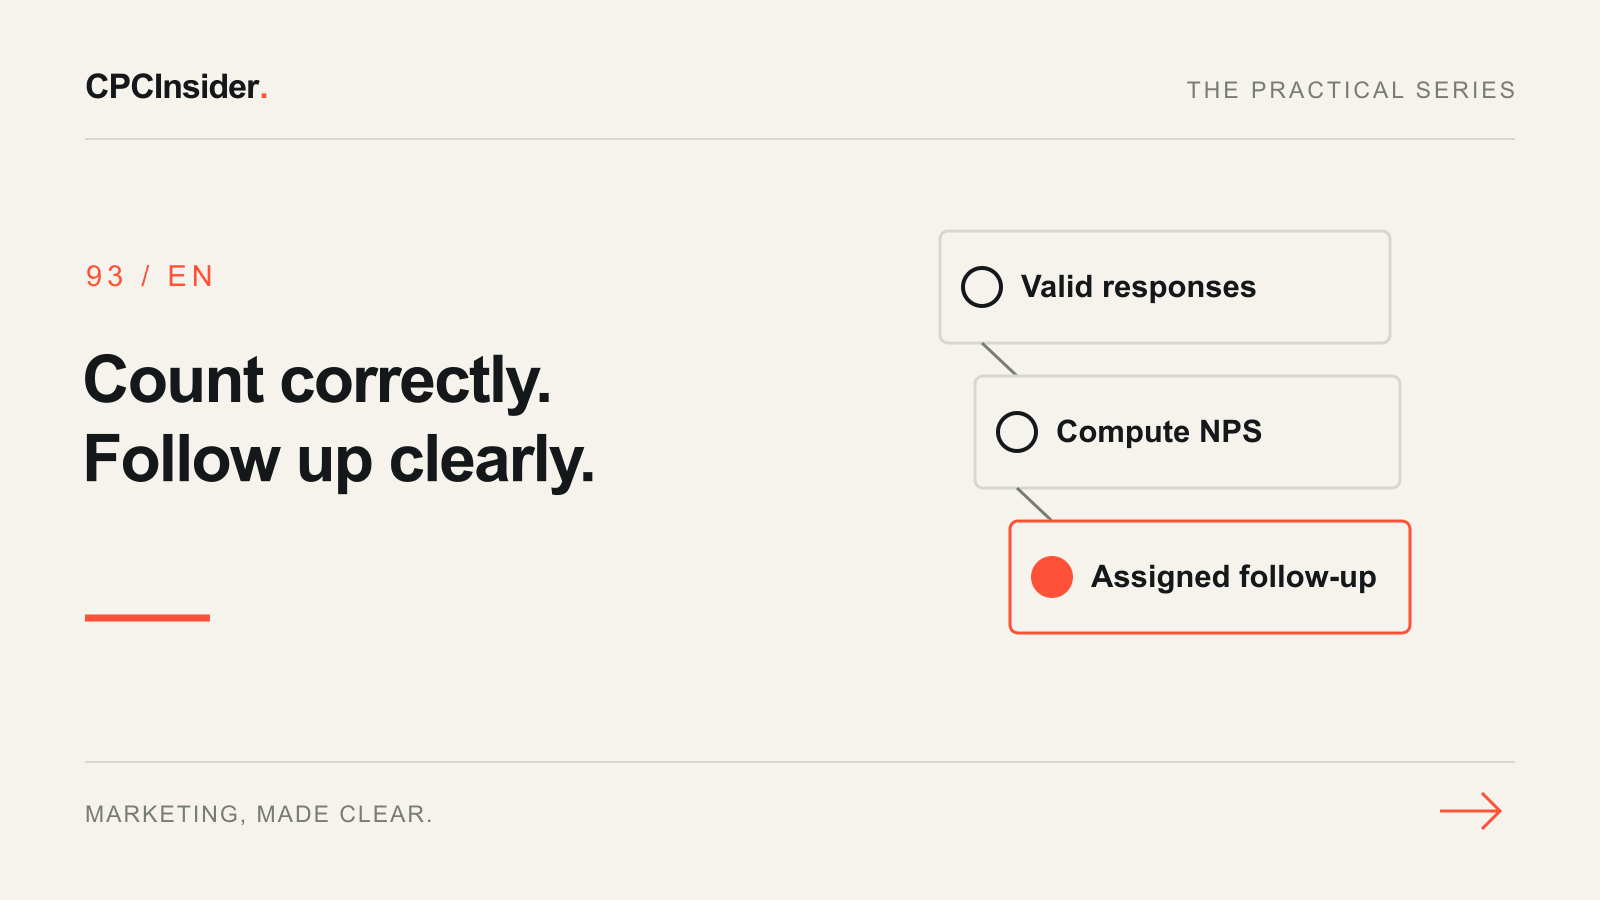
Your NPS changed, but nobody can tell whether customer sentiment changed or a different group answered. Open the response export and compare the invitation rule, dates and valid response count before presenting the new score. Keep the raw counts alongside it.
NPS summarises willingness to recommend. For a particular delivery or support interaction, use the customer satisfaction survey guide. For actual repeat-customer behaviour, use the retention rate calculation.
1. Use the established scale
Bain’s NPS definition uses a recommendation question on a scale from 0 to 10. Responses of 9–10 are promoters, 7–8 are passives and 0–6 are detractors. NPS equals the promoter percentage minus the detractor percentage.
Passives remain in the denominator. Keep blank, invalid and duplicate entries separate from valid answers. Decide whether your reporting unit is a person or a customer account and how repeated submissions are handled before calculating.
2. Build a checkable spreadsheet
Put one accepted numeric answer per row in column B, with the respondent key and survey round in separate columns. Restrict the input to whole numbers from 0 to 10. Remove duplicates according to the documented rule before applying these formulas.
| Output | Formula for rows 2–1000 |
|---|---|
| Valid response count, E2 | =COUNT(B2:B1000) |
| Promoters, E3 | =COUNTIF(B2:B1000,">=9") |
| Detractors, E4 | =COUNTIFS(B2:B1000,"<>",B2:B1000,"<=6") |
| NPS, E5 | =IF(E2=0,"",100*(E3-E4)/E2) |
These formulas assume the cleaned, validated numeric column described above. Enter the three counts in E2, E3 and E4, then the score in E5; local spreadsheet settings can require semicolons instead of commas. Show NPS as points on a scale from −100 to +100, without percentage formatting. With no valid responses, leave the score blank.
Google’s COUNTIFS reference explains the multiple-condition count used to exclude blank responses.
3. Preserve the comparison group
Record the invite count, response count, customer segment, language, channel, timing and question wording. Compare like-for-like groups over equal periods. If the next round includes a different market or customer age, show that difference before interpreting the score.
A low response count can make the result sensitive to a few answers. Non-response and invitation selection can also affect it. Do not interpret a changing score as proof of revenue growth or a specific marketing effect.
4. Give feedback an owner
Ask an optional open question about the reason for the score. Check specific problems against service records and give each actionable issue an owner. HubSpot’s loyalty-survey guide describes practical survey and follow-up controls; confirm what your own setup supports.
Keep individual responses private and record whether follow-up resolved the issue. Include passives and promoters when learning about the experience, rather than using the survey only to request positive reviews.
Your review output
Keep one cohort definition, the checked calculation and a list of assigned actions. Our Business Growth service connects customer evidence with priorities. Request a free founder-led growth review for a 30-minute conversation and a short written plan with three priorities.
About the author
Free founder-led growth review
Know where to focus your next marketing investment.
In a focused 30-minute conversation, we review your advertising, website and sales follow-up together. Afterwards, you receive a short written action plan you can use with your own team or with ours.
Your biggest growth gaps
See where your ads, website or follow-up may be losing potential customers.
Your next 3 priorities
Get a ranked action list with the reason for each recommendation and what to check next.
A practical starting plan
Leave with clear next steps for your team, plus our recommendation if you want help implementing them.
Continue reading
Customer retention rate: turn the number into one practical improvement
Use customer retention rate to identify where customers leave, investigate the reasons and plan one measurable improvement with clear ownership.
Customer satisfaction survey: turn one recent experience into a practical fix
Design a short survey about one customer interaction, test the recipient rules and assign a follow-up owner. Includes a worksheet and reporting checks.
Customer retention rate formula: calculate it correctly in a spreadsheet
Calculate customer retention rate with worked examples and spreadsheet formulas. Check new-customer counts, opening cohorts and common reporting mistakes.